0293ef13...
184de23b...
50965730...
193075c2...
5b96ba6b...
1f375010...
Adapt the 20-minute workflow to handle maps and process diagrams effectively.
How non-chart visuals change the workflow.
When writing an IELTS Task 1 report for a map or process, the standard data chart workflow changes. There are no numbers to compare, so your 20-minute planning phase requires a different focus to meet the grading criteria.
Visual comparison of workflows.
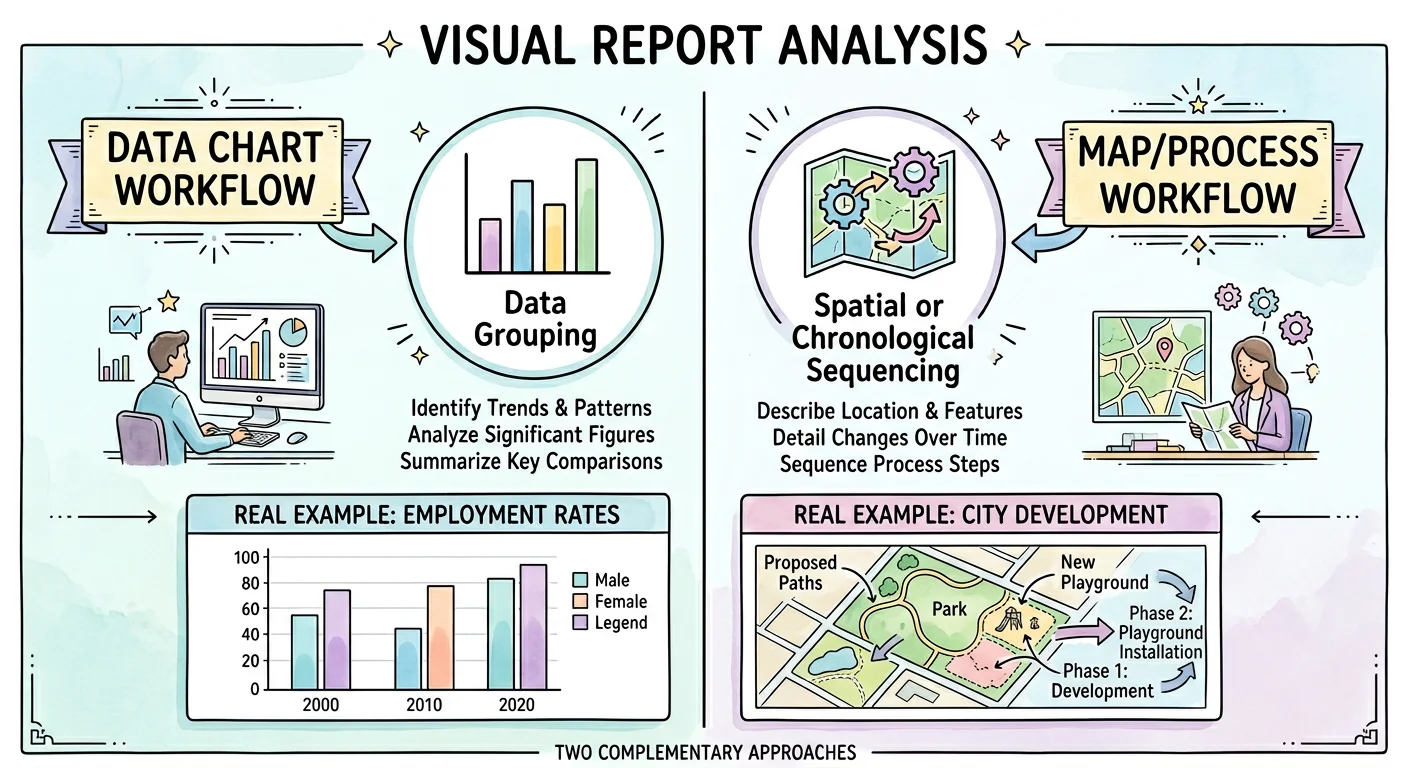
Adapt your grouping strategy based on whether you are looking at numbers, locations, or steps.
Pre-writing checklist for non-chart visuals.
Guided reflection on map/process planning.
Define a clear physical boundary for each paragraph.
Remember, human-made changes require passive voice.
Self-explanation on future improvements.