2d89b9af...
79a1cb96...
adc852fc...
6dda3d78...
From MP3s to Instagram filters
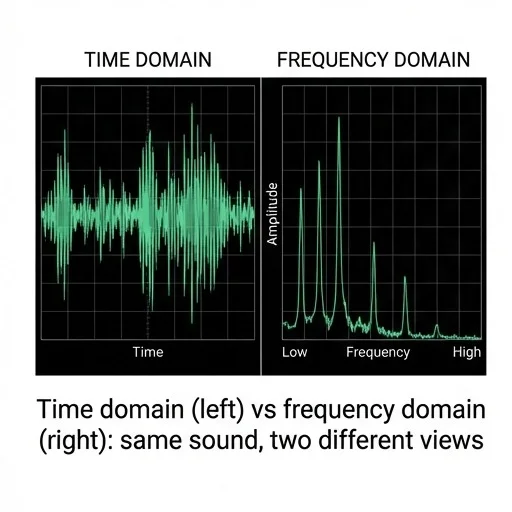
Time domain (left) vs frequency domain (right): same sound, two different views

Equalizer: each slider controls one frequency range independently (Fourier components)
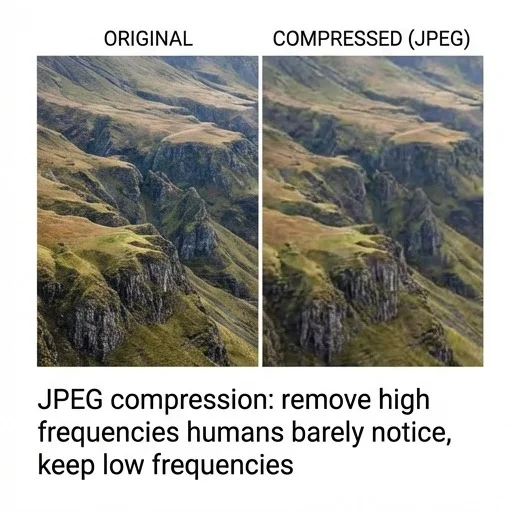
JPEG compression: remove high frequencies humans barely notice, keep low frequencies
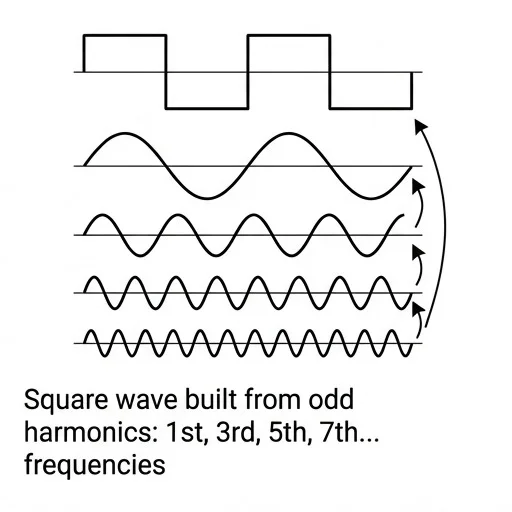
Square wave built from odd harmonics: 1st, 3rd, 5th, 7th... frequencies
Your voice saying "hello" contains maybe 50 different frequencies mixed together.
MP3 compression: break the sound into frequencies, delete the ones you can't hear (above 20kHz, below 20Hz), keep the rest.
Result: 10% of original size, sounds identical.
The math behind this? Fourier decomposition — the visualization above.
Think in frequencies for audio and images
Instagram's blur filter removes high-frequency components. In terms of Fourier analysis of the image, this means: